See the other winter forecasts for cities across the country, the AO, NAO and even Canada and Europe! Click Here
"Much of the nation can expect some frigid weather this winter."
Hello everyone, and welcome to The Weather Centre's Official 2013-2014 Winter Forecast. This forecast will examine the indices most likely to play a significant role in the coming winter, as well as several hints and clues we can pick up from the weather we experienced this past summer. Bear with me- this post is quite long, but I promise you it will still be easy to understand no matter how into weather you may be.
We will begin with an analysis of one of the main drivers of the seasonal climate, the El Nino-Southern Oscillation (ENSO).

This chart shows sea surface temperatures for the four regions included in the El Nino-Southern Oscillation (ENSO) phenomenon. The ENSO phenomenon involves anomalous sea surface temperatures across these four regions on the chart above. When sea surface temperatures are below normal in the second graph from the bottom, it is said that a La Nina is in place. In similar fashion, above normal sea surface temperatures (SST's) in the Nino 3.4 region correspond to the term 'El Nino'. Both the La Nina and El Nino have different effects on the United States- an El Nino brings about a snowy and cold East Coast, while allowing warm and dry weather to flourish in the Plains and Midwest. A La Nina permits cool and snowy weather to hit the Ohio Valley and Midwest, while warming up portions of the Southern US. Looking at the image above, I want to focus on the bottom chart first, labeled Nino 1+2. The Nino 1+2 area is located in the waters just offshore of Ecuador, as the image below shows:
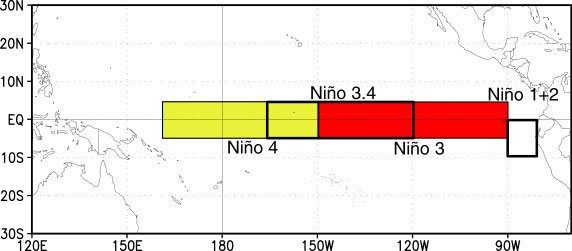
The Nino 1+2 region has been rather significantly below normal for the past summer, at one point reaching the -2.0 level (which is very negative). The Nino 3 and 3.4 regions also were below normal for the summer, but it is apparent that the Nino 1+2 and Nino 3 regions held the brunt of the cold.
Statistics from Americanwx user donsutherland1 indicate that when the Nino 1+2 region is below normal in summer, 83% of cases led to La Nina development in the winter. The other 17% of cases led to Neutral ENSO development, which means SST's are not cold enough to be a La Nina, and are not warm enough to be called an El Nino. The water temperatures are neutral.

This animation shows temperature composites for west and east-based La Ninas and El Nino's. The difference between west and east based is in the name: If you have something that's west-based, it means the temperature anomalies of an El Nino or La Nina are on the western side of the ENSO monitoring area. Likewise, an east-based El Nino or La Nina means anomalous sea surface temperature anomalies are in the eastern side of the ENSO monitoring area. Currently, if one was to classify the ENSO situation, we would be in an east-based La Nina, which would support a cooler than normal Northern US. Don't get too hung up on this item, though; the east-based region (Nino 1+2) is notorious for not affecting the weather in North America too much.

Model guidance from the ECMWF model ensemble system suggests the current ENSO state will warm up to a weak El Nino by the time winter rolls around. Due to the aforementioned statistics on a cold Nino 1+2 summer and winter consequences, as well as forecasts in the past that indicated we were supposed to be well into an El Nino by now, I'm pretty skeptical on the idea of an El Nino. Right now, I believe we will see a Neutral ENSO winter, though if water temperatures stay cold enough we could see a weak La Nina.
We now take a broader look at the sea surface temperatures around the globe to get a feel for other atmospheric patterns that rely on these sea surface temperature anomalies (SSTA's) to work. The first one we will look at is the Pacific Decadal Oscillation, or PDO.
The PDO has two phases- a positive (warm) phase, and a negative (cool) phase. In the +PDO phase, we see below normal sea surface temperatures extending from northeast Asia across the North Pacific and to the waters well offshore Western Canada and southern Alaska. Immediately offshore of these regions, we see above normal SSTA values. The opposite set-up occurs in a -PDO. In the negative PDO, we find above normal SST anomalies stretching from east Asia across much of the northern Pacific and into the Northeast Pacific. Below normal SST values are found just offshore the western coast of North America.
In the positive PDO, the Southeast tends to experience above normal precipitation, while the southern Ohio Valley will see slightly drier than normal conditions. In the temperature department, just about everyone east of the Front Range experiences below normal temperatures, except the Northern Plains, which sees above normal temperatures. The negative PDO sees the opposite of all this, with much of the US warm in a -PDO, and precipitation trends finding the Southeast in a dry area, but the lake effect snow belts in the Great Lakes at above normal precip levels. Right now, the PDO appears to be trying to switch phases from negative to positive. At the moment, I'm still expecting a negative PDO for the winter, and the chances of a neutral to slightly positive PDO this winter are low, but not completely zero.
Looking back at the global SSTA chart above, we see rather variable sea surface temperatures in the waters in northeast Canada and by Greenland. This means the positive Atlantic Multidecadal Oscillation (AMO) we have been seeing recently is losing its grip. A +AMO is defined by above normal sea surface temperatures in the Arctic Ocean, and a negative AMO sees the Arctic Ocean in cooler than normal temperatures. A +AMO tends to enhance the likelihood of a negative North Atlantic Oscillation, which then helps cold and snow enter the Northeast and overall Eastern US. If we see that the +AMO is weakening (which it has been over this past spring), it does not bode well for the chances of a negative NAO this winter. Luckily, the AMO is just one of many factors that go into the chance of a negative NAO, many of which we will discuss below. For this winter, I anticipate the AMO to be rather neutral, maybe a bit negative.
To round out this SST discussion, research I have conducted does indicate that there is a solid connection between sea surface temperatures and high/low pressure anomalies. For example, positive SSTA's lead to higher pressure, while negative SSTA's lead to lower pressure. Because sea surface temperatures take a prolonged period of time to cross the anomaly spectrum (from below normal to above normal or vice versa), we can begin looking at global SST's to find potential locations for mid level height anomalies. Right off the bat we see strong positive SST anomalies across the Pacific. This bodes well for high pressure placement in the Bering Sea and general North Pacific, something I will discuss further in my analog package discussion below. A concerning item is the above normal SST swath off the East Coast. If this body of +SST anomalies leads to high pressure formation, it could happen that we see periods of anomalously warm weather along the Eastern Seaboard that could then maximize cold weather in the Plains. But that's still a while away.
Here's the basis of why I'm issuing my winter forecast so early: my winter analog package. I took into account many factors, including the PDO, ENSO, AMO, and sunspot numbers, with many others also adding to the mix.
The years I took into account were 1962-1963 and 2008-2009. I did drop my previous analog year of 1951-1952 due to an uneasiness I had using it. These years were chosen after an initial check back in the spring for my Preliminary 2013-2014 Winter Forecast, and were recently put through a rigorous examination to assure these are the two years that fit the bill for my analog package.
The first item we will analyze is the mid level atmospheric pattern for the winters of these two analog years. Right off the bat, we note significant below normal height anomalies across North America. This bodes well for below normal temperatures in Canada, extending into the United States. Taking a glance across the Arctic Circle, we find positive height anomalies stretching from Greenland to the Bering Sea. These two positive height anomaly areas do three things that significantly impact winter weather across the Northern Hemisphere:
I: The Polar Vortex is disrupted.
Take a look at the North Pole. We do not see any significantly below normal height anomalies that are composed in one fragment over that region. Rather, we see the two aforementioned positive height anomaly areas disrupting this negative height anomaly area. Thus, the polar vortex, which encompasses a massive amount of cold air from the Arctic, is permitted to weaken and slide to lower latitudes. If the analog package verifies this winter, it is very possible the polar vortex may shift into North America.
II: Sudden Stratospheric Warming (SSW) Chances Increase.
It is well established that the Bering Sea is a favorite place for the origination of sudden stratospheric warmings (SSW's), a phenomenon that involves rapid warming in the stratosphere that then allows unusually cold air to reach the surface and lower latitudes just a couple of weeks later. Last winter, we saw a magnificent SSW originate from the Bering Sea, and other warmings attempt to take place in that same vicinity. With positive height anomalies stationed over the Bering Sea, intrusions of warm air by these positive height anomalies into the Arctic are more easily accomplished, thus increasing the likelihood of SSW events. Due to very strong +SST anomalies across the Northern Pacific and extending into the Bering Sea, chances of persistent high pressure in this area would drastically rise if the current water temperature pattern does not significantly change by the time winter comes.
III: The North Atlantic Oscillation is Negative.
The North Atlantic Oscillation (NAO) is a phenomenon that involves height anomalies across Greenland. In the negative NAO, high pressure is stationed over the land mass in a move that permits cold air and Nor'easter's to affect the Eastern US. On the other hand, a wintertime positive NAO results in a warmer United States with lower probabilities of big snowstorms for the nation as a whole. The analog package above suggests that the upcoming winter NAO will tend to be on the negative side.

Next, we'll take a look at temperature anomalies for these two analog years. It is clear that, should the analog package verify, the trend across the nation would be for below normal temperatures. These below normal temperature anomalies were mainly produced by a very cold winter of 1962-1963, which is the analog year I am favoring out of the two. The Great Lakes was hit hardest by the cold, with the Northern Plains in close second. The West US region manages to emerge from this cold nation to an above normal winter prognosis of these two analog years.

Precipitation anomalies were very dry across the nation as a whole, which I'm pretty skeptical of going into this winter. Indications are that the Southern Plains precipitation trend should verify in response to ongoing drought conditions, but I am not sure about those drier than normal anomalies stretching into the Midwest and Ohio Valley. The same goes for the Mid-Atlantic. I do anticipate either an average or slightly below average Southeast this winter. Expect a general dry trend across the West US if predicted ridging along the West Coast holds up.

Let's take a look at the stratosphere height anomalies for the two winters. It's pretty obvious that the stratosphere was not in good shape for these two winters in the sense that the polar vortex is nowhere near its normal place in the upper latitudes; rather, we find it unusually weakened and stationed in western North America. The positive height anomaly dominance, combined with favorable SSW probabilities due to the Bering Sea height anomalies tells me that the stratosphere will see the polar vortex struggling at points in the upcoming winter.
Let's take a look at why the polar vortex is so depleted here. We have already established that we have a positive QBO in place, which helps to strengthen the polar vortex. It is currently rounding out from its mature phase, which was seen in mid July. The issue here is that both of my analog years had a positive QBO, while a +QBO for this upcoming winter is to be decided by how quickly the current +QBO pulse wants to progress. If we do have a negative QBO come winter, chances are the polar vortex would be stronger than what my analogs are predicting above, but if persistent high pressure sets up in the Bering Sea, I wouldn't be too concerned. It does appear the QBO is now trying to move to a negative phase, which would allow for not as strong a polar vortex this winter. Chances are modest that we will embark upon a negative QBO by the start of winter, but the probability of getting to a -QBO in the second half of winter is much more favorable.

An item I did not previously put into my analog set is the sunspot number we have seen this past summer into fall. The chart above shows the sunspot number since 2000 to the current date. To give a little perspective on how this chart works, take a look at the line between the numbers 11 and 12, which signifies the sunspots in the year 2011. You can see a spike in sunspot numbers immediately prior to the line numbered 12, which tells us the sunspot number spiked in the fall of 2011. It's no coincidence the winter of 2011-2012 came out as a very warm winter as a result of this spiking sunspot number. We saw a spike in sunspot numbers just three or four months into this year, which led to a large heat wave in June into July. Now, as we head into the fall, sunspot numbers have plummeted. Could this lead to a cooler fall? No doubt it will not be warm, and chances are heightened that the fall season will be a bit chilly. If we see plummeting sunspot numbers continuing into the fall, I would be pretty confident in a cold winter ahead. But once again, we would need to see rather consistent low sunspot numbers.
Alright, enough of the explanations. Let's get to the forecast.

We'll start with temperatures. I anticipate a chilly winter for many in the Plains, Great Lakes and East US. Due to the likely presence of a Southeast Ridge at times, I cut off portions of the coast for these cool temperatures. The threat of ridging across the northern Atlantic adds to uncertainty for the Northeast. It is the Midwest and western Great Lakes regions that are likely to get the core of this winter's cold. A favorable analog package, combined with favorable model forecasts make me believe that it will be cities like Chicago, Minnesota, St. Louis and Dubuque that may see the coldest weather of the season. It should be noted that there is potential for this cold to be delayed until the second half of winter, should the fall pattern turn out warmer than expected. I anticipate a warmer than normal Southwest, and this may have to be extended along the West Coast in a later outlook if model forecasts remain consistent with their current outlook.

Precipitation is a wild card this year. With a ridging pattern expected along the western coast of North America, drier than normal conditions are expected. I'm not completely confident in the entire Western US receiving dry weather, which is why it is labeled 'Rather Dry' over just dry. Due to the ongoing drought in the South Plains, dry conditions are likely for that area. Such dry conditions may be maximized in Texas. Above normal precipitation should present itself across the Midwest and central Great Lakes in response to a favorable storm track, and this brings us to the Plains area. I could see this going either way. For one, if we see ridging in the West shift to the east, drier conditions would be more likely. On the other hand, if we see many pieces of energy riding the jet stream through this area, above normal precipitation may fit the bill. The East Coast should average out around normal.

And now for the forecast you have all been waiting for: the snowfall forecast. I anticipate snowy conditions across the Great Lakes, Upper Midwest and the overall Midwest. This is a combination of a favorable (and likely active) storm track across the area, and what could be a rather persistent Southeast Ridge. I would not be surprised to see multiple subsantial snow events for cities like Detroit, Chicago, Cleveland, Indianapolis, and even Green Bay. The below normal snow forecast in the Plains is a bit misleading. It goes along the lines of what I discussed with the Plains precipitation forecast and how it could go either way. So please don't get disappointed if you are in the below normal snowfall area; it is very much subject to change.
Bear in mind this is all subject to change. If you have questions, put them in comments below and I will try to answer them when I find the time. The final winter forecast will most likely come out in late October.
Andrew


 Shown above is a map of the mid level atmospheric flow in the winter of 1962-1963. Yellows and reds indicate high pressure, while blues and purples depict low pressure. We want to look towards Greenland at this point. When we find that land mass, we see an abnormally large area of high pressure in and just to the east of Greenland. If you recall in my explanation of the NAO, high pressure over Greenland indicates the formation of the negative NAO. Consequently, low pressure anomalies have developed over much of the Eastern and Central US. It is likely that, should my primary analog verify, the NAO would remain negative for the majority of the winter.
 Andrew


