Tonight, we will be watching scattered clusters of showers and dying storms dissipate, but probably stick around into the midnight hours. Even then, some showers may continue as a low pressure system will be generally stationary on the East Coast. Farther out west, a low moving out of Colorado will push a cluster of showers and storms into the Kansas/Nebraska border, where a severe thunderstorm watch is in effect at this time for a little while more. Some showers will also be present going into Utah, and a much more isolated shower/embedded storm activity up in Montana in the presence of a low pressure system.

Sunday, August 14, 2011
August 13, 2011 Indianapolis State Fair Raw Video Footage of Stage Collapse
This is a video captured from someone at the Indianapolis State Fair when the stage collapsed.
BEFORE YOU WATCH, BE ADVISED THAT THIS VIDEO IS GRAPHIC. VIEWER DISCRETION IS STRONGLY ADVISED.
Video from derhamm
BEFORE YOU WATCH, BE ADVISED THAT THIS VIDEO IS GRAPHIC. VIEWER DISCRETION IS STRONGLY ADVISED.
Video from derhamm
2011-2012 Winter Forecast: 2nd Version
Hello everyone, this is the 2nd version of the 2011-2012 winter forecast for the US.
The Weather Centre has determined that a weak La Nina is likely going into this winter. The CPC has issued a La Nina watch, indicating a La Nina is possible but not certain. Let's start off by taking a look at current Surface Sea Temperature (SST) charts.
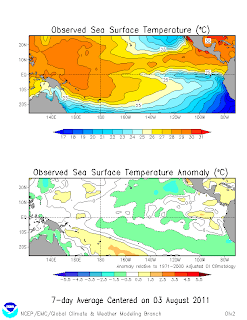 On the top we see current SST charts. Notice the cooling in the eastern regions of the ENSO regions. Last year, we had a strong 'east-based La Nina'. What this means is that the coolest SST anomalies were centered in the eastern regions of the ENSO area. For ENSO region locations, see the image below.
 To the image at the top, we see SST anomalies aren't displaying any significant signs of a La Nina. However, with the SST's falling rapidly, it can be expected that a La Nina will occur. And while many other factors go into these forecasts, this remains our preliminary forecast, and we will base it as such.
Something else we can forecast for is the NAO, or North Atlantic Oscillation index.
The NAO is basically associated with a permanent low pressure system over Iceland (Icelandic Low) and permanent high pressure system over the Azores (Azores High). These two vary in daily and monthly etc. strengths, and that variation is called the NAO. Below you can see an example of the variations in pressure.

When the pressure difference (because high pressure has higher pressure and low pressure has lower pressure) is strong, that is a +NAO index. When that difference is lower, that period is called a -NAO index. Below is a graph depicting past NAO index readings.
 You can see how the NAO went negative during practically the whole 2010-2011 winter. Recently, the NAO has also been down. When the NAO is negative, it leads to heat waves across the US. you can see how the heat relates to the negative NAO by taking a more short-range past look at the NAO below.
 You can compare the recent massive heat waves with the NAO index.
All that information considered, we have constructed the 2nd version of the 2011-2012 winter forecast. See the charts below.
 The Weather Centre anticipates much of the North US to be cold and possibly frigid. And while that may be too far south, it is expected that at least some of the southern US will be warm. This comes as solar activity begins to decrease to a very large degree. This will actually cool the whole world down, but since we will be entering at least a slight La Nina, the southern US will be at least a bit warm.
 Precipitation will probably take another slight form of last year, but at this point, i'm not really sure. The reason is that there are tons more parameters that we are not able to correctly forecast at this time. That said, we are making an educated guess on this precipitation forecast.
 It will be more snowy in the Northeast as more monster storms will bear down on the area. Additionally, there will probably be more snowfall in the Great Lakes into the Upper Midwest, with the best likelihood in the lake effect snow areas and Upper Midwest. But we will see.
The Weather Centre has determined that a weak La Nina is likely going into this winter. The CPC has issued a La Nina watch, indicating a La Nina is possible but not certain. Let's start off by taking a look at current Surface Sea Temperature (SST) charts.


Something else we can forecast for is the NAO, or North Atlantic Oscillation index.
The NAO is basically associated with a permanent low pressure system over Iceland (Icelandic Low) and permanent high pressure system over the Azores (Azores High). These two vary in daily and monthly etc. strengths, and that variation is called the NAO. Below you can see an example of the variations in pressure.

When the pressure difference (because high pressure has higher pressure and low pressure has lower pressure) is strong, that is a +NAO index. When that difference is lower, that period is called a -NAO index. Below is a graph depicting past NAO index readings.


All that information considered, we have constructed the 2nd version of the 2011-2012 winter forecast. See the charts below.


2011-2012 Winter Forecast will be released in ONE HOUR
The 2nd version of the 2011-2012 Winter Forecast will be released in ONE HOUR.
Please note this post is from August.
Please note this post is from August.
August 13 Indianapolis State Fair Storm Stage Collapse Q & A

Q: What caused the stage to topple?
A: Look at the radar image above. Do you see a thin bright green line right in front of the storms? That is called 'outflow', or rain-cooled air. Like spilling liquid on a floor, thunderstorms will shoot down bursts of rain-cooled air that will spread out in all directions. If it is strong enough, it may even show up on radar, like it did last night. That outflow can be dangerous with very strong winds. As that outflow came through, the winds were so strong that the stage collapsed.
Q: How strong was the wind?
A: The National Weather Service estimated wind speeds at 60-70 MPH.
Q: Is outflow called a microburst?
A: A microburst is an especially strong blast of wind downwards from storms that can be considered life threatening. The term isn't widely used anymore, however. So specific types of outflow can be called a microburst, but rarely does that happen.
Q: Why didn't people just run away from the stage and go inside?
A: The outflow traveled so fast and came before the storm, so people watching the radar may have been unaware that the outflow had formed and was coming before the storm.
Subscribe to:
Posts (Atom)